Users who wish to simulate the uv coverage of the MeerKAT interferometer for given source coordinates and observation duration can use the MeerKAT uv coverage simulator. It is available as a standalone Jupyter notebook or it can be accessed online. Note that the latter may take several minutes to load. Users will need to install the Python katpoint package.
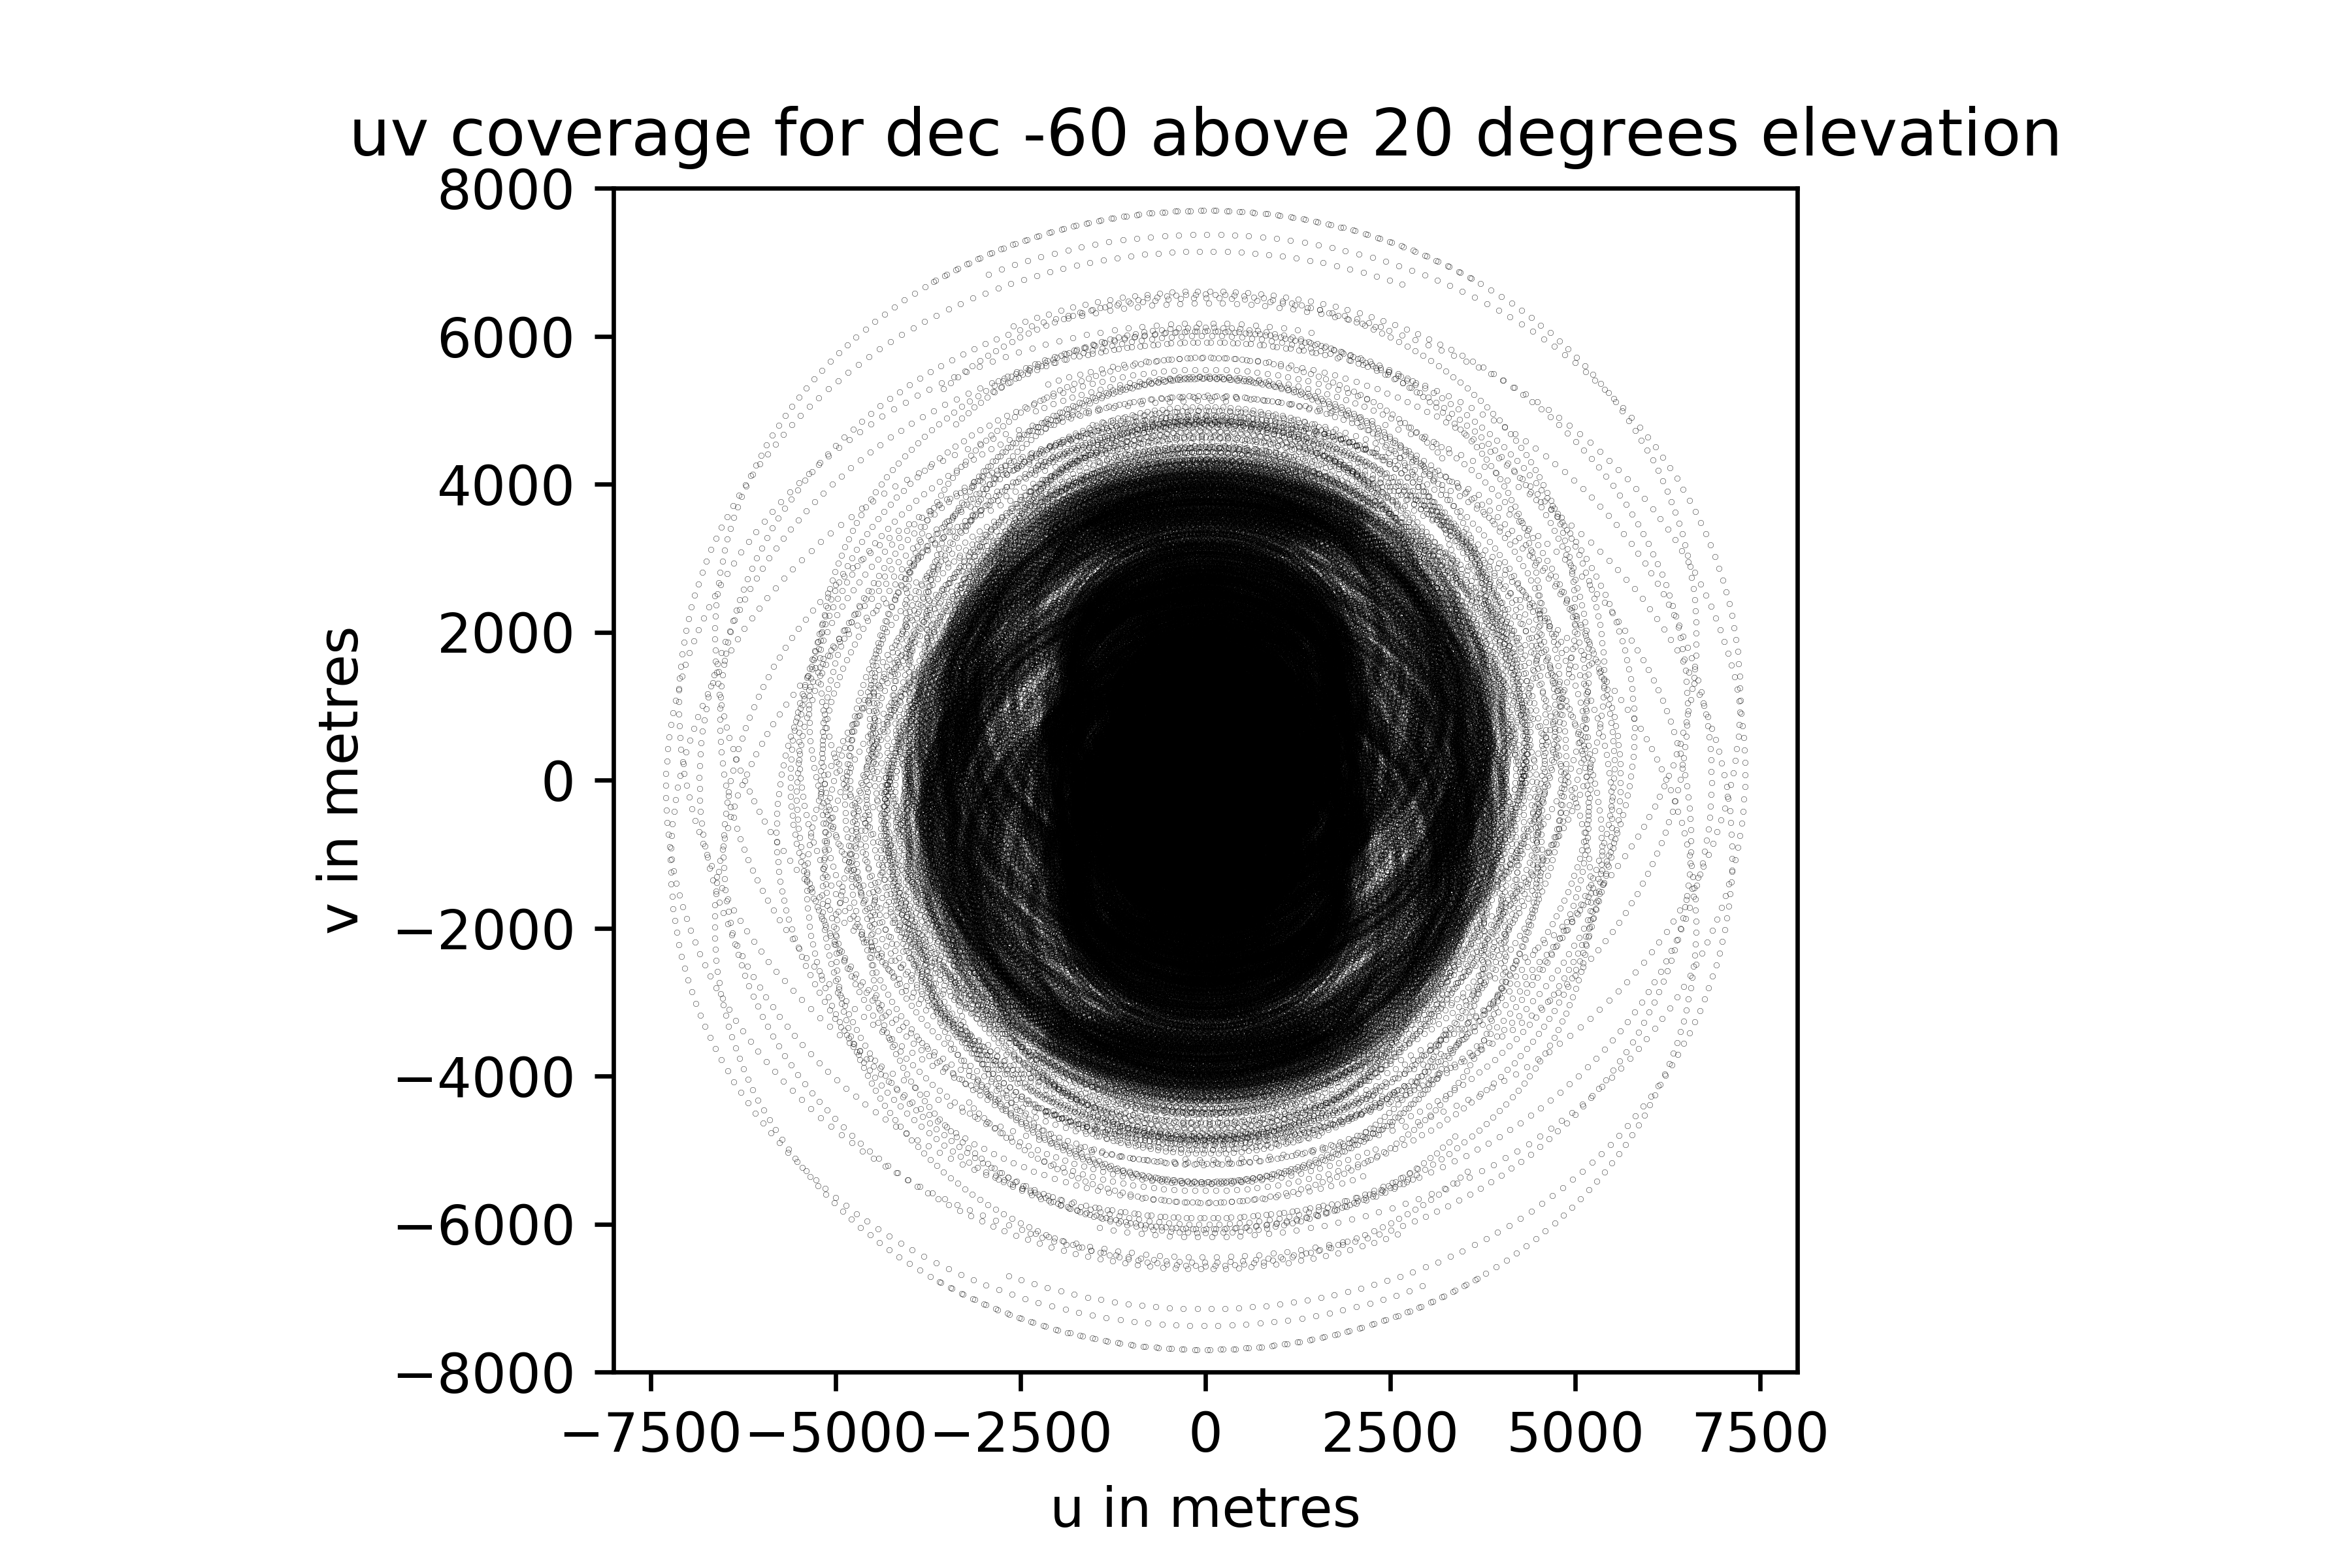
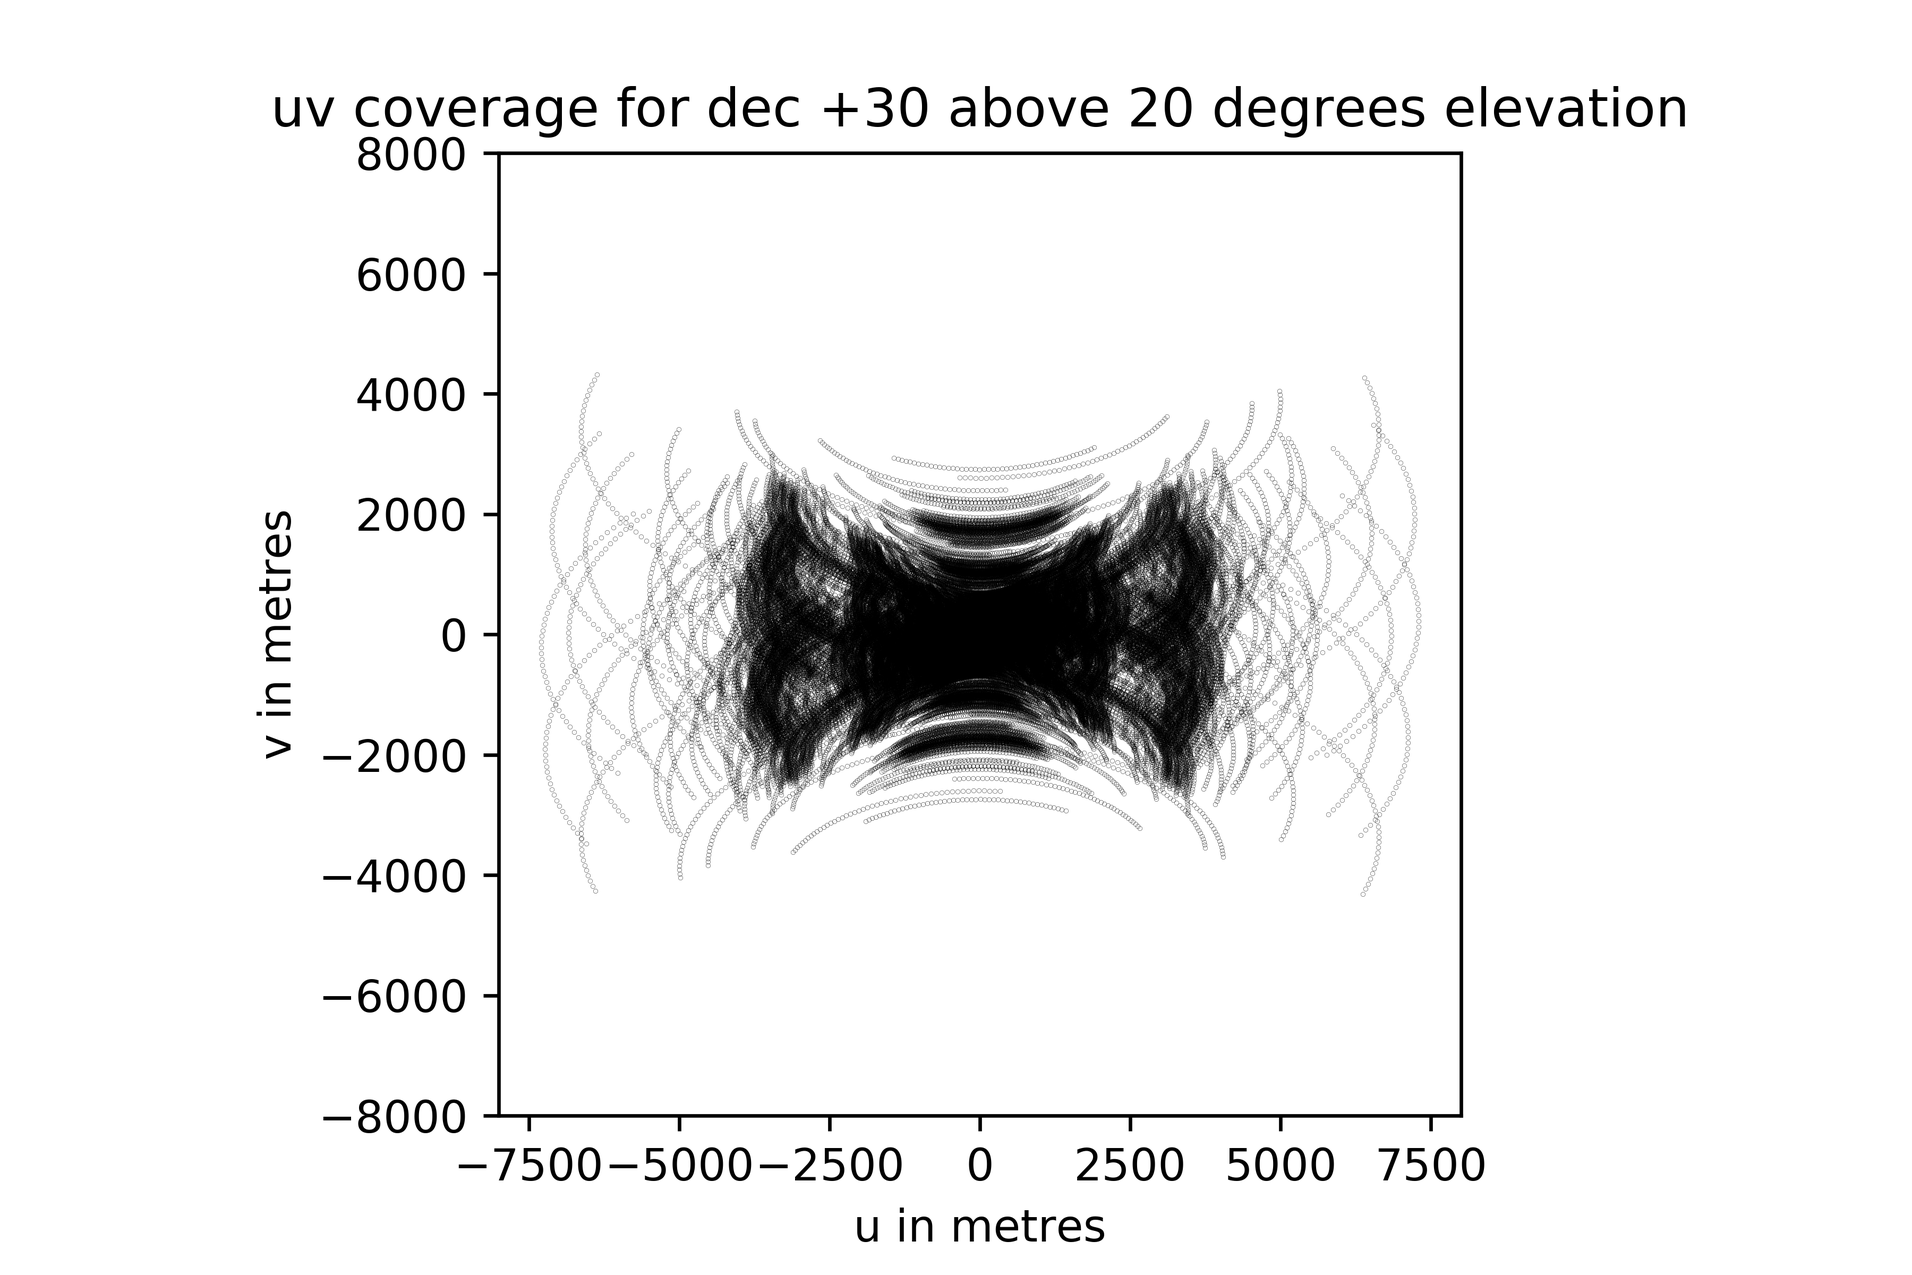
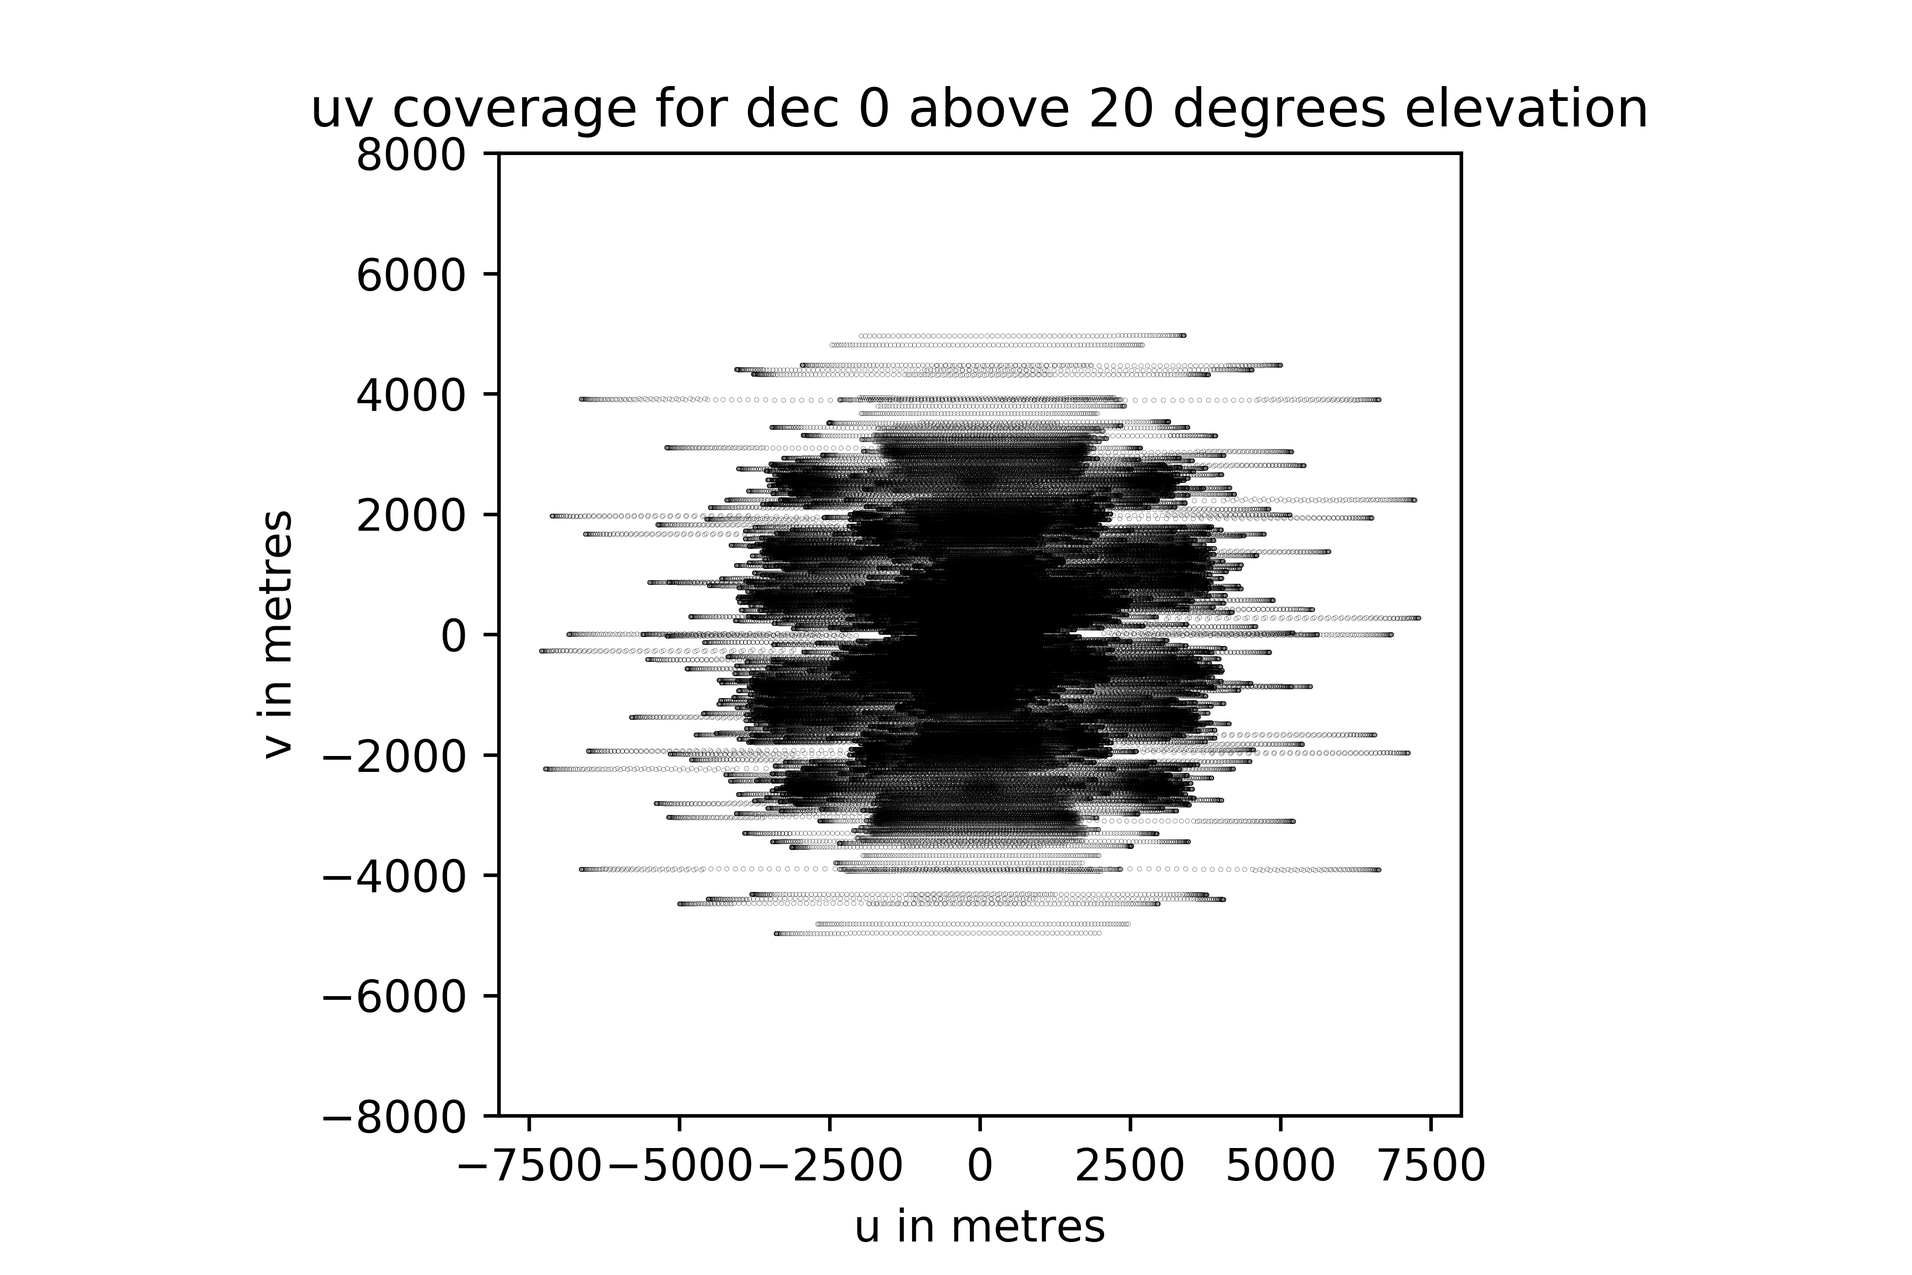
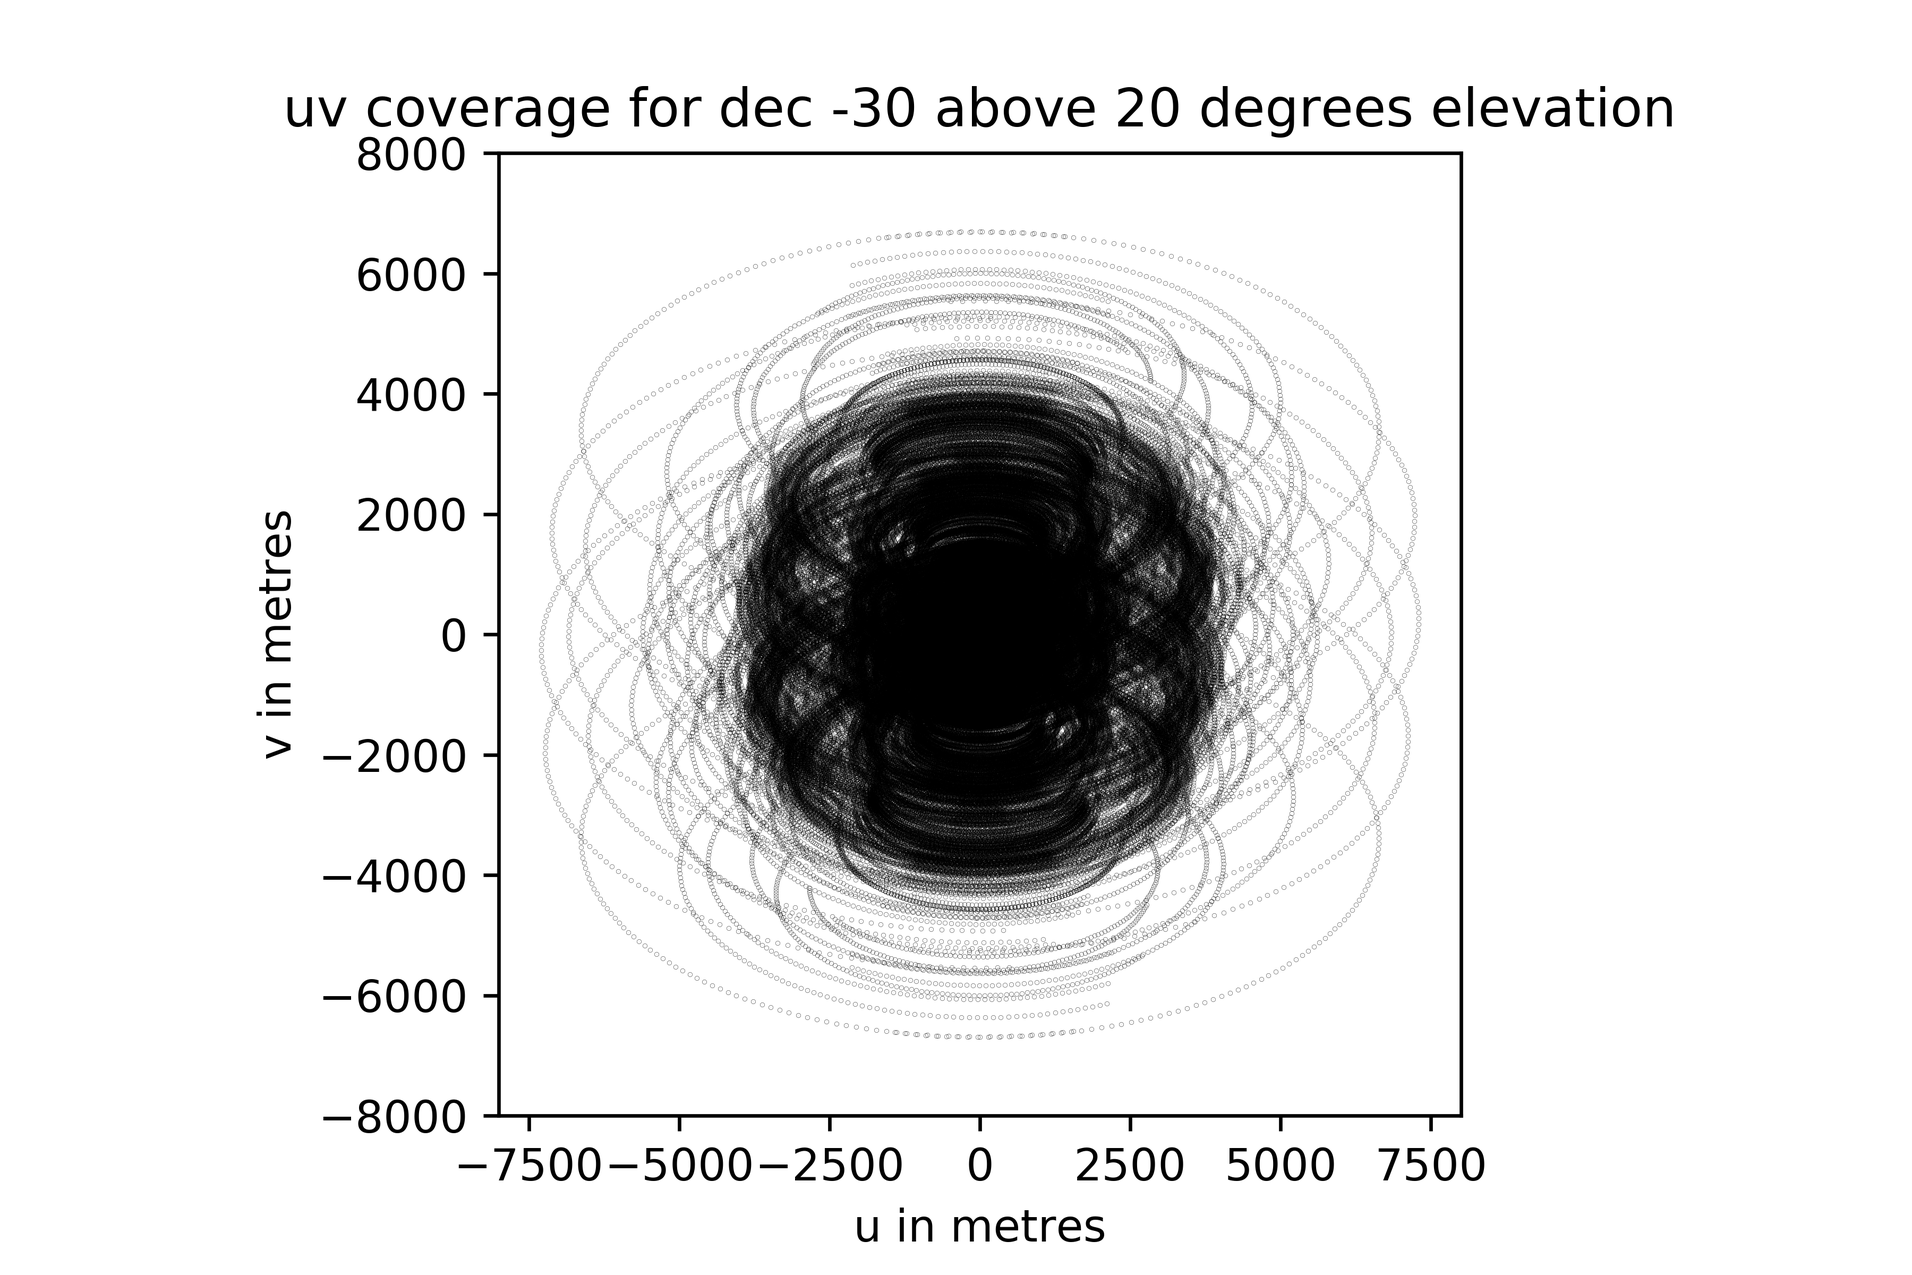
After declaring your variables in the User input cell, click Cells → Run All in the menu to execute the calculations and plot the uv coverage for your source using the menu at the top of the notebook. The output plots are frequency-independent and can be scaled by dividing by your wavelength of interest. We reproduce some example plots from MeerKAT specifications, which were produced using this simulator:


Last revised - 07 August 2020