| Table of Contents |
|---|
SARAO conducts regular RFI monitoring, both by analysing telescope data as well as independent on-site monitoring. However, some RFI may only emerge after deep integrations and may not be detected by standard RFI flaggers. Users who find any anomalies not noted below are encouraged to inform the observatory by raising a helpdesk ticket under ‘Data quality’.
Frequency occupation
Frequency ranges of the most persistent sources are described in Table 1 and subsequent figures.
Table 1: Summary of major RFI contaminated regions of the L-band range.
RFI source | Frequency range (MHz) |
Digital TV (UHF) | 8 MHz “rectangular” broadband: (306 + Channel# x 8) +/- 4 MHz |
GSM (Mobile phones) (UHF + L-band) | 880 - 915 uplink 925 - 960 downlink |
Aircraft transponders | Multiple <1 MHz bandwidth intermittent signals between 962 and 1213 MHz |
GPS | L1: 1565 - 1585 |
GLONASS | L1: 1592 - 1610 L3: 1202.025 |
Galileo | E1: 1575.42 E5a: 1176.45 E5b: 1207.14 E5 AltBOC: 1191.795 E6: 1278.75 |
Iridium | 1616 - 1626 |
Inmarsat | 1526 - 1554 |
L-band statistics
There are three major contributors to RFI in the MeerKAT L-band frequency range: Global System for Mobile Communication (GSM), Distance Measurement Equipment (DME) on aircraft and Global Navigation Satellite System (GNSS) satellites.
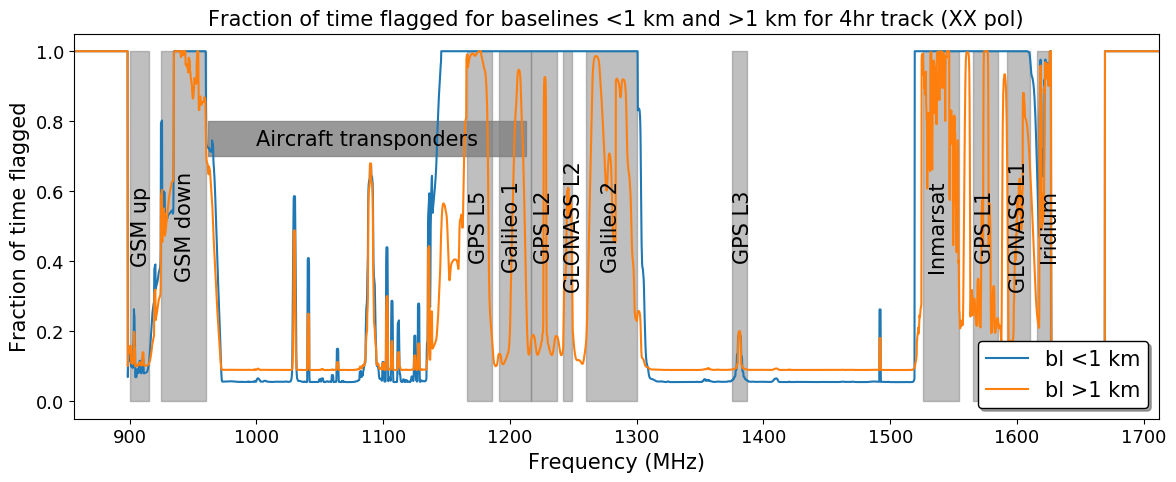
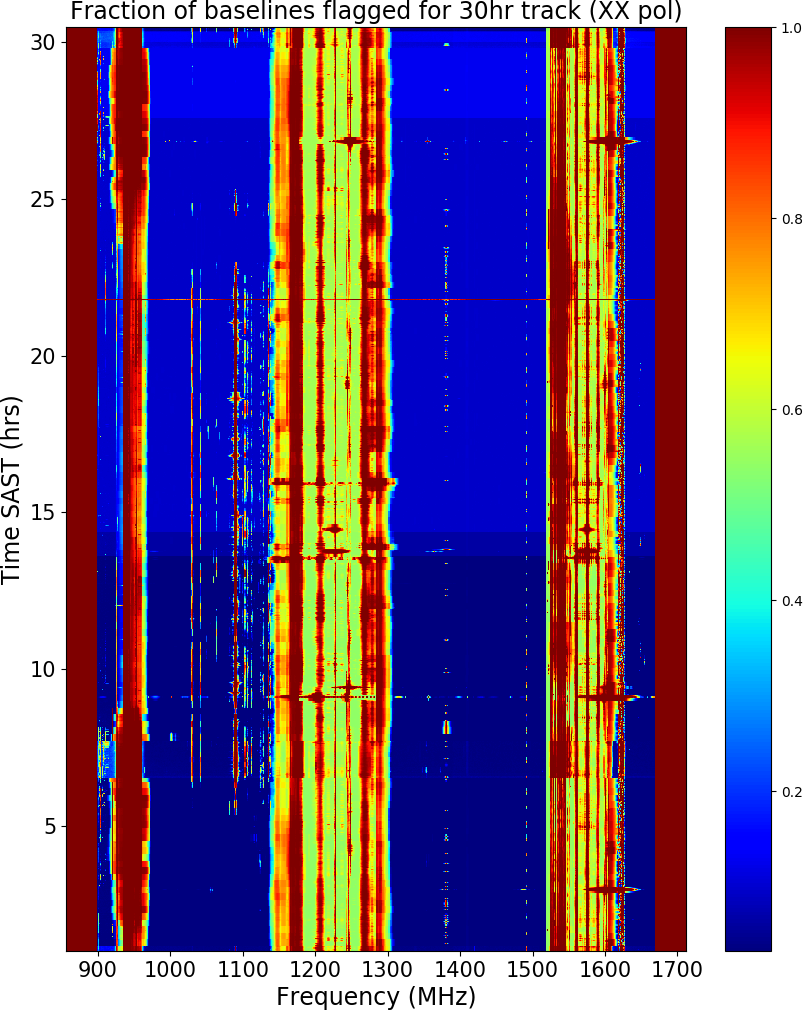
We show an example of the typical RFI environment, as observed during a 30 hour run on primary calibrators over Christmas Day 2019, in Figures 1 through 4. The science data processor (SDP) pipeline flagger output is also shown.
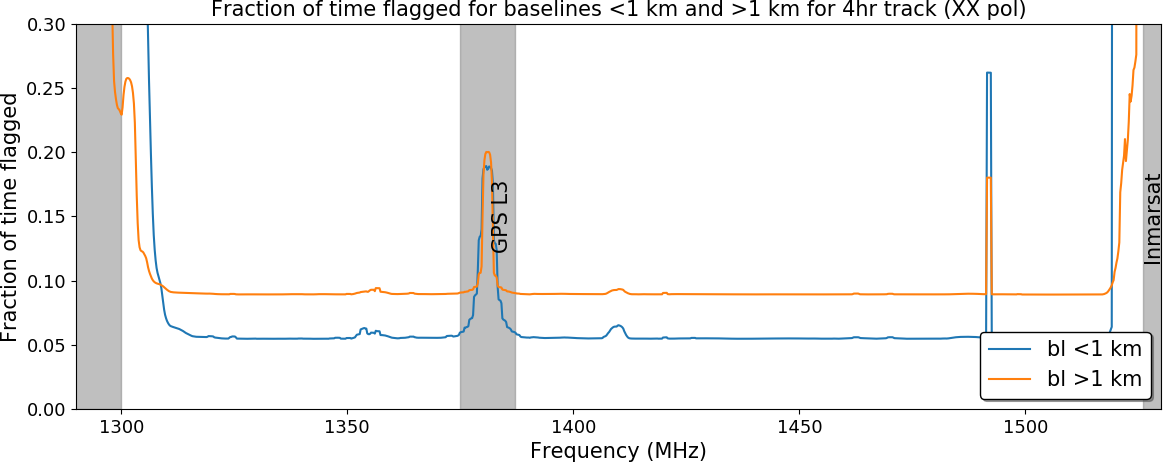
Note that, in the interests of speed, the online flagger uses a very aggressive static mask (based on long term observation statistics), which masks all known transmission bands on baselines out to 1 km. This enables reasonable calibration solutions to be produced. Users may wish to disable these flags on their target fields and adopt their own flagging strategies. A second pass at flagging after applying calibration solutions also improves the detection of fainter RFI signals.
Time dependence
Activity from aircraft transponders is at a minimum from ~23:00 to 06:00 SAST under typical operating conditions. Figure 3 is of an observation that includes this window.
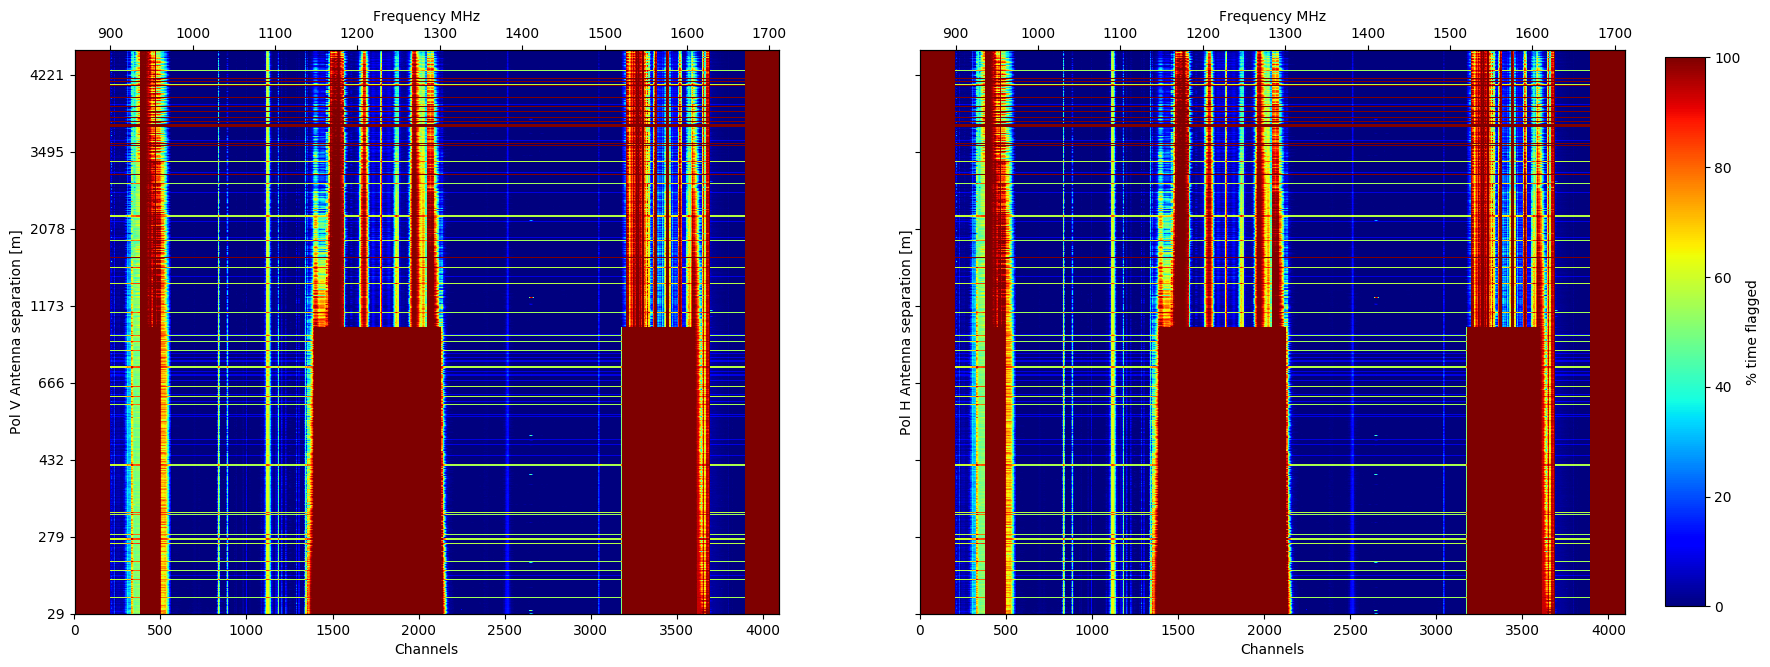
Baseline dependence
The frequency ranges in Table 1 are included in the SDP pipeline static mask but are only applied on baselines shorter than 1 km (see Figure 4) since most of the RFI decorrelates on longer baselines. Note that this is an aggregate mask built up over time, and it is possible to recover more channels on an individual observation if manual or outlier-based flagging is used instead.
UHF statistics
There are no satellite-based transmitters in the UHF band. The primary sources of RFI are GSM, and Digital TV transmissions (DTV). All DTV transmissions are beamed away from site, with the exception of distant transmitters which are occasionally detected - they are generally transmitted over the horizon by anomalous tropospheric ducting. It is expected that the situation will improve in future as further sites discontinue terrestrial transmission.
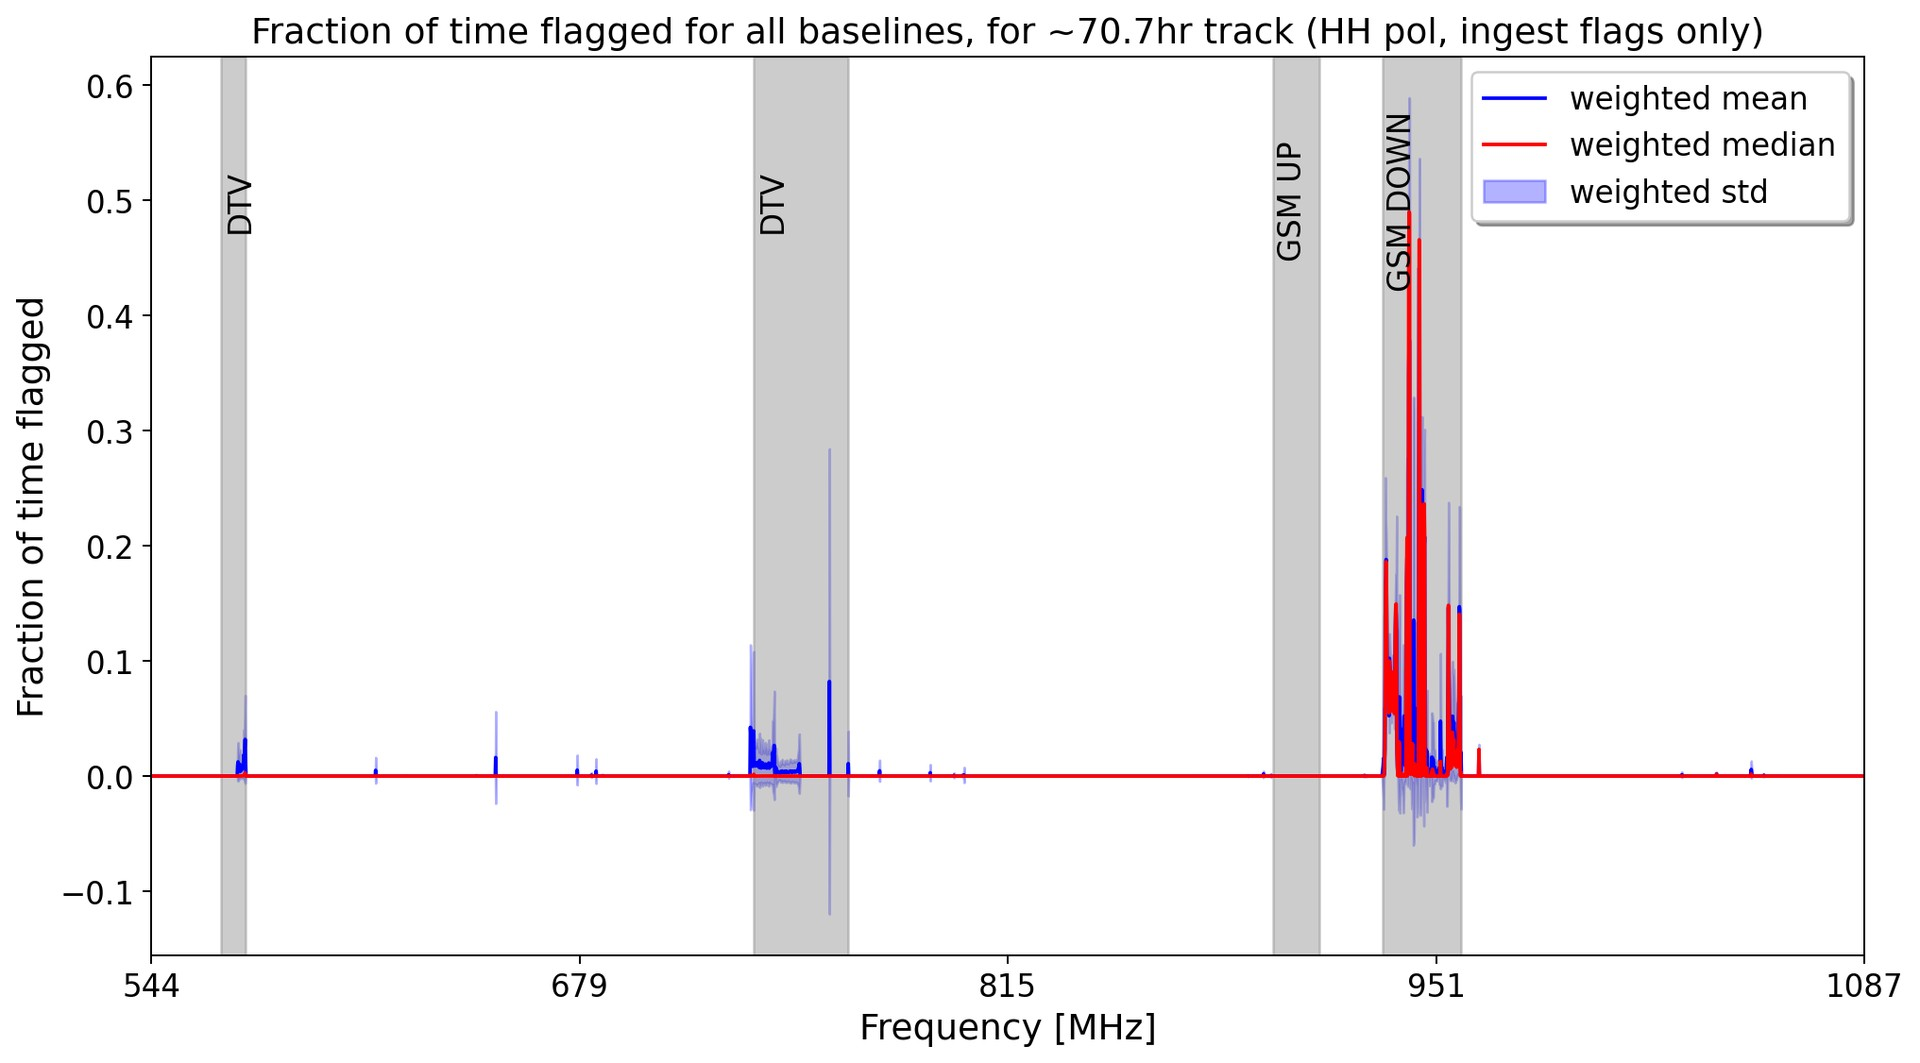
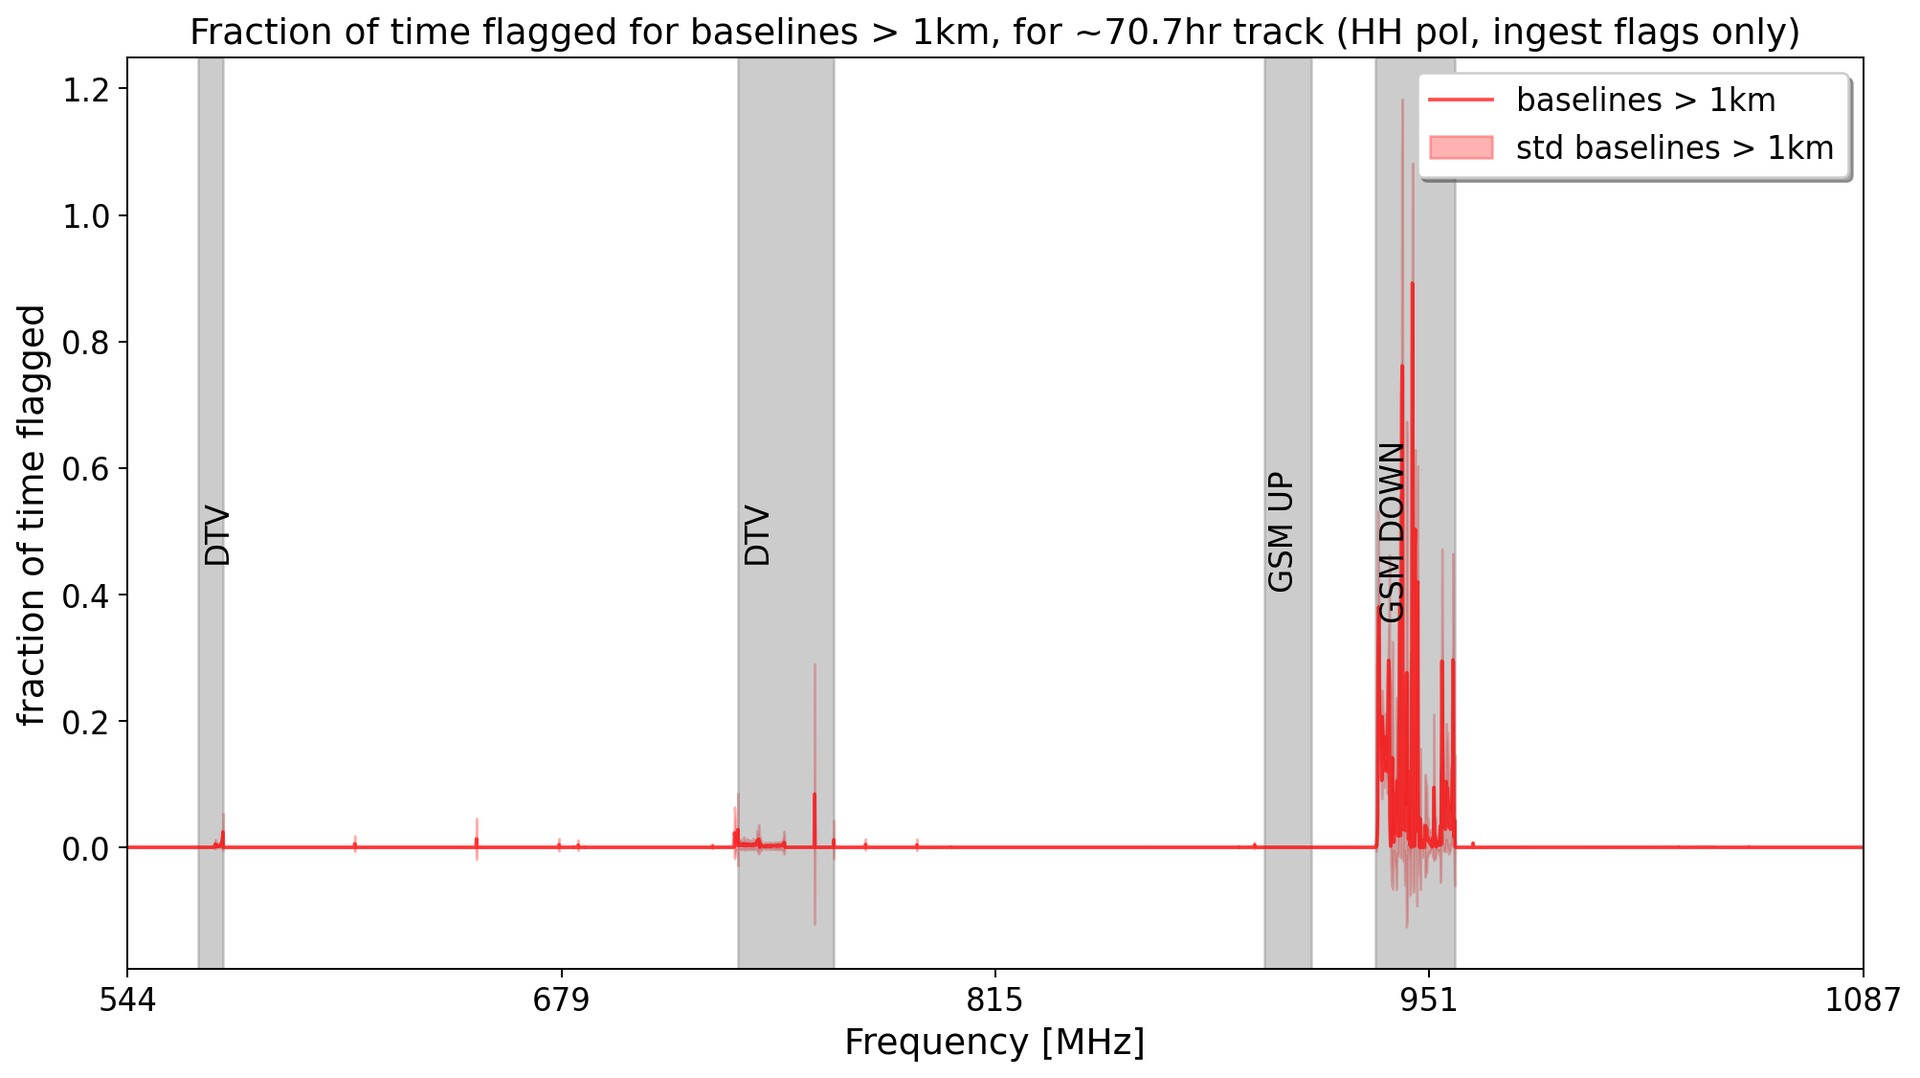
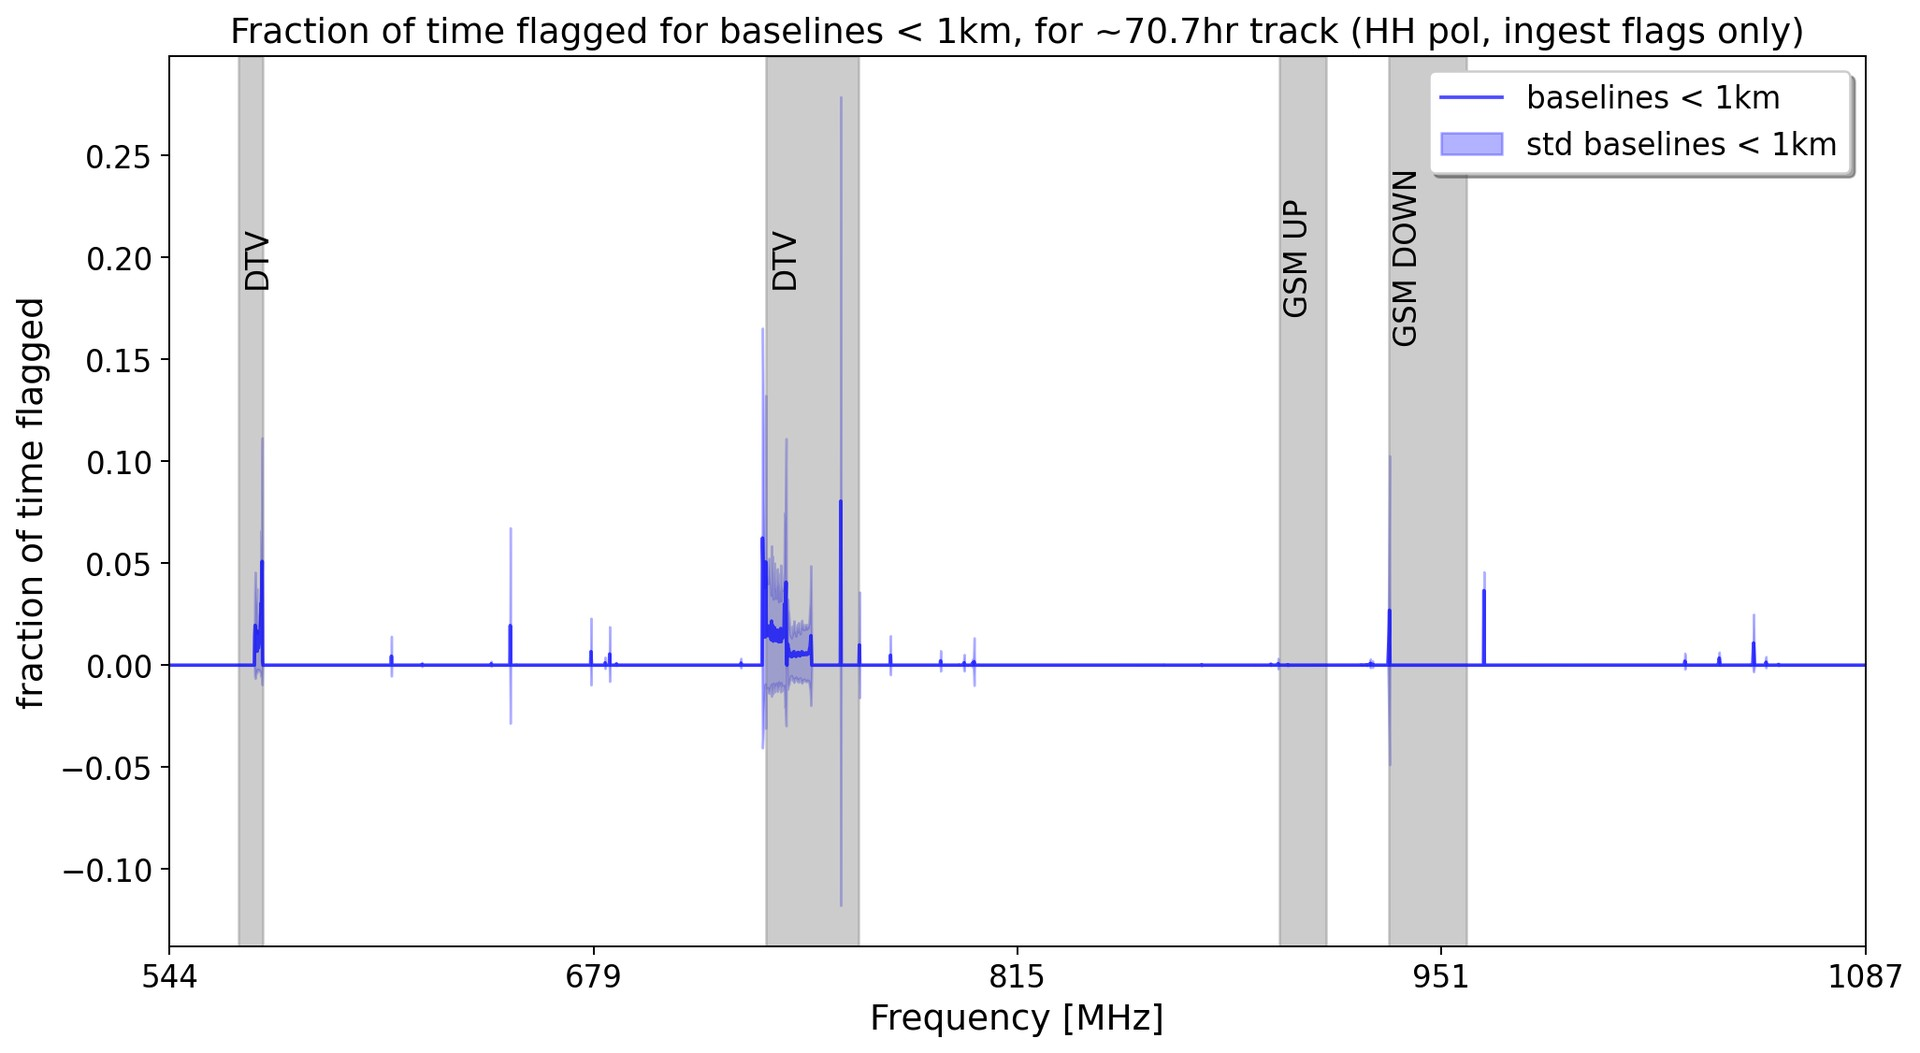
Figures 5 and 6 below show the aggregated results of UHF (4K mode) observations carried out between 2021-02-27 to 2021-09-11, totaling about 70 hours of integration, in random pointing directions. Flags generated by the SDP ingest flagger (prior to calibration) are used for this analysis.
The very faint RFI detections are under investigation. The following frequency ranges are affected by faint but persistent RFI:
759.1 - 759.2, 798.6 - 798.9, 925.1 - 925.3, 965.5 - 965.6, 1028.8 - 1030.9, 1040.3 - 1041.8, 1062.9 - 1065.0 MHz
Additionally sporadic spikes are found at the following frequencies:
647.1, 653.1, 735.3, 741.4, 765.3, 896.6, 899.3 - 899.4 and 928.0 - 935.0 MHz.
These often result in positive / negative localized spikes in the target source spectra.